Same Number of Innings, Vastly Different Numbers, and the Questions They Raise
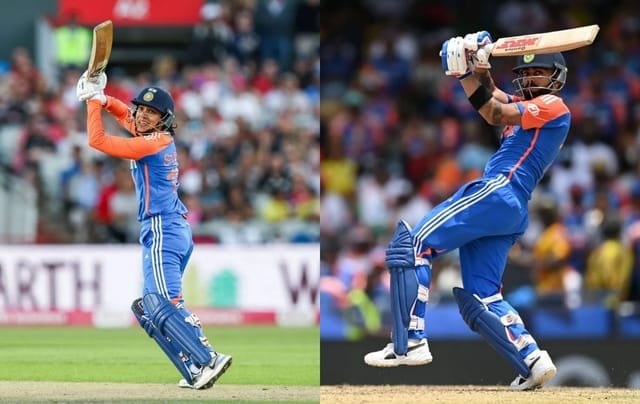
Statistical comparisons in cricket are most interesting when they illuminate something beyond the surface numbers: when they reveal character, approach, and the specific circumstances in which each player has been tested. The comparison between Smriti Mandhana and Virat Kohli after their respective 25th T20 World Cup innings is one of those comparisons that generates more questions than it resolves, and in doing so, creates a genuinely useful frame for thinking about what India’s vice-captain will need to accomplish at the 2026 Women’s T20 World Cup in England and Wales.
The tournament runs from June 12 to July 5, and Mandhana arrives as India’s most consistent batting performer in the format, a 29-year-old left-handed opener who has been one of women’s cricket’s most recognizable and reliable names for nearly a decade. India won the Women’s ODI World Cup at home last year, adding to a collection of achievements that has made the national team one of the sport’s most celebrated sides. But the Women’s T20 World Cup title has not yet arrived, with the most painful near-miss being the 2020 final at Melbourne Cricket Ground, where India lost by 85 runs to Australia in front of a record-breaking crowd.
Whether this tournament provides the breakthrough depends substantially on what Mandhana produces at the top of the order across potentially six or seven matches. The numbers from her first 25 innings in the competition, compared to what Kohli had achieved at the same benchmark, reveal both the distance between them and the specific areas where Mandhana’s improvement would most dramatically transform India’s tournament prospects.
The Overall Record: Where the Gap Is Largest
The headline comparison after 25 T20 World Cup innings is stark and demands honest engagement rather than diplomatic softening.
| Batter | Innings | Runs | Average | Strike Rate | Highest Score | Centuries | Half-Centuries |
|---|---|---|---|---|---|---|---|
| Virat Kohli (after 25 innings) | 25 | 1,141 | 81.50 | 131.30 | 89* | 0 | 14 |
| Smriti Mandhana (after 25 innings) | 25 | 524 | 21.83 | 114.41 | 87 | 0 | 4 |
Kohli’s 1,141 runs at an average of 81.50 and a strike rate of 131.30 after 25 T20 World Cup innings is among the most remarkable statistical records any batter has ever produced in international tournament cricket. The average of 81.50 is elevated significantly by his habit of remaining not out: a player who scores at this rate across 25 innings without ever making a century is scoring consistently in the fifties, sixties, seventies, and eighties, converting his starts into maximized innings repeatedly across multiple tournaments.
His 14 half-centuries from 25 innings means he reached fifty-plus in more than half his innings. His best of 89*, scored off 47 balls against the West Indies at Wankhede Stadium in the 2016 T20 World Cup semifinal, reflects the peak of his tournament expression: 11 fours, one six, and an innings that carried India to a famous win in front of their home crowd. His 82* off 51 balls against Australia in Mohali in 2016, featuring nine fours and two sixes, adds further evidence of what sustained excellence in this format at its most meaningful level looks like.
Mandhana’s 524 runs at an average of 21.83 and a strike rate of 114.41 after the same benchmark is the record of a very good player in an inconsistent relationship with the biggest stage. Her four half-centuries include some genuinely outstanding individual performances: 87 off 56 against Ireland in Gqeberha in the 2023 edition, featuring nine fours and three sixes, and 83 off 55 against Australia in Providence in the 2018 edition. These are innings that demonstrate the ceiling of her T20 World Cup ability. The gap in half-century count (14 vs 4) reflects the gap between what that ceiling represents and how consistently she reaches it.
The strike rate comparison (131.30 vs 114.41) is also significant in a format where the difference between those rates, across an innings of 40 or 50 balls, can amount to several runs that directly affect match outcomes. Mandhana is scoring at a rate that, while acceptable by some T20 standards, falls below what her ability level suggests should be achievable in a format where she is the established captain of the batting order.
Batting in Wins: The Contribution When It Matters
The comparison in winning matches provides the most directly relevant picture of each batter’s contribution to their team’s success in the tournament.
| Batter | Wins | Runs in Wins | Average (Wins) | Strike Rate (Wins) | Fifties (Wins) |
|---|---|---|---|---|---|
| Virat Kohli | 19 (17 innings) | 809 | 115.57 | 133.27 | 10 |
| Smriti Mandhana | 14 | 362 | 27.84 | 121.88 | 3 |
Kohli’s 809 runs at an average of 115.57 in winning matches is essentially the statistical definition of a team-defining batter: when he scores, India win. His average in wins (115.57) compared to his average in losses (47.42) is not as dramatic a gap as some might expect, because even in losing causes he was delivering substantial contributions. But the ten fifties from 17 innings in wins reflects a player who was consistently producing match-defining batting when the result ultimately favored his team.
Mandhana’s 362 runs at 27.84 in India’s 14 Women’s T20 World Cup wins represents a positive contribution to the majority of those victories, with three half-centuries demonstrating her capacity to produce meaningful innings when the team is succeeding. The drop to 162 runs at 14.72 in losses reflects what appears across both the Mandhana and Kohli data: that individual performance and team outcomes are correlated, and that batting below one’s best level in a T20 World Cup match is often both a contribution to and a reflection of a team’s difficult day.
The strike rate improvement in wins (121.88 vs 100.62 in losses) is the most instructive number in the wins comparison for Mandhana. She scores significantly faster when India are winning, which suggests either that the conditions and match situations in winning games are more favorable to her style, or that her mindset and execution are at their best when the team is in a positive position. India will need her to find the winning-match mindset from the first ball of each innings rather than waiting for conditions to confirm it is appropriate.
The Knockout Gap: Where the Comparison Is Most Revealing
The most pointed and important section of this comparison is the knockout record, because T20 World Cup knockout matches are where careers are defined and where the difference between a good player and a great one is most consistently revealed.
| Batter | Knockout Matches | Runs | Average | Strike Rate | Best | Fifties |
|---|---|---|---|---|---|---|
| Virat Kohli | 4 | 288 | 144 | 152.38 | 89* | 4 |
| Smriti Mandhana | 3 | 47 | 15.66 | 130.55 | 34 | 0 |
Kohli’s knockout record across four T20 World Cup matches is a statistical argument that needs no additional commentary: 288 runs at an average of 144 and a strike rate of 152.38, with four half-centuries across four matches. His 89* against the West Indies at Wankhede in the 2016 semifinal is perhaps the single most celebrated T20 World Cup innings ever played, requiring 19 runs from the final over and producing them with a combination of skill, calm, and something that transcends statistical description. His 77 against Sri Lanka in the 2014 final and his 50 against England in the 2022 semifinal in Adelaide complete a record of knockout consistency that is genuinely without peer.
Mandhana’s knockout record presents the sharpest challenge for India’s tournament aspirations in 2026. Forty-seven runs from three knockout appearances, with no half-centuries and a best of 34 against England in the 2018 semifinal, is the record of a player who has not yet found the version of herself that these moments require. Her 11 in the 2020 final against Australia, and her 2 in the 2023 semifinal against Australia in Cape Town, are the figures that explain the 85-run final defeat and the semifinal exit that prevented India from reaching that final.
The statistical gap in knockout batting is larger than any other section of this comparison. Kohli averaged 144 in his four knockout innings. Mandhana averaged 15.66 in her three. The difference between those numbers is the difference between a player who finds extra reserves in the highest-pressure moments and a player who, to this point, has found those moments most difficult to navigate.
Against Specific Opponents: The Australia and England Dimension
For the 2026 Women’s T20 World Cup in England and Wales, the two opponents that matter most to any realistic assessment of India’s chances are England, as host nation with home conditions, and Australia, who have consistently been the final obstacle in India’s most ambitious campaigns.
Mandhana’s record against Australia across five T20 World Cup innings (112 runs, average 22.40, strike rate 123.07) suggests a competent but not dominant relationship with the world’s most successful women’s T20 side. Her 83 off 55 in Providence in 2018 represents the high point of that sub-series record; the 2020 final’s 11 represents its low point. The average of 22.40 does not suggest a batter who has found a consistent method for addressing Australia’s varied bowling attack in this format.
Against England, four innings have produced 99 runs at an average of 24.75 and a strike rate of 117.85. In conditions that are now England’s home ground, this modest-to-acceptable record against the hosts represents another challenge for the tournament opener. England on their own pitches, with overhead conditions that favor their seamers and spinners, will be a specific and demanding environment for every opposition batter. India will need Mandhana to perform significantly above her historical average against this opponent in conditions she will not have lived in daily.
What the Numbers Mean for India’s 2026 Campaign
The comparison with Kohli’s record is not presented to diminish Mandhana. It is presented to frame the specific gap between what she has produced in T20 World Cup cricket and what the highest individual standard in this format has looked like. The gap is real and the numbers are honest about it.
But cricket’s statistics are records, not destinies. Kohli’s knockout record was not inevitable from his opening T20 World Cup innings. It was built through specific innings in specific moments, each of which required the right circumstances, the right prep
For breaking news and live news updates, like us on Facebook or follow us on Twitter and Instagram. Read more on Latest Sports on thefoxdaily.com.

COMMENTS 0